


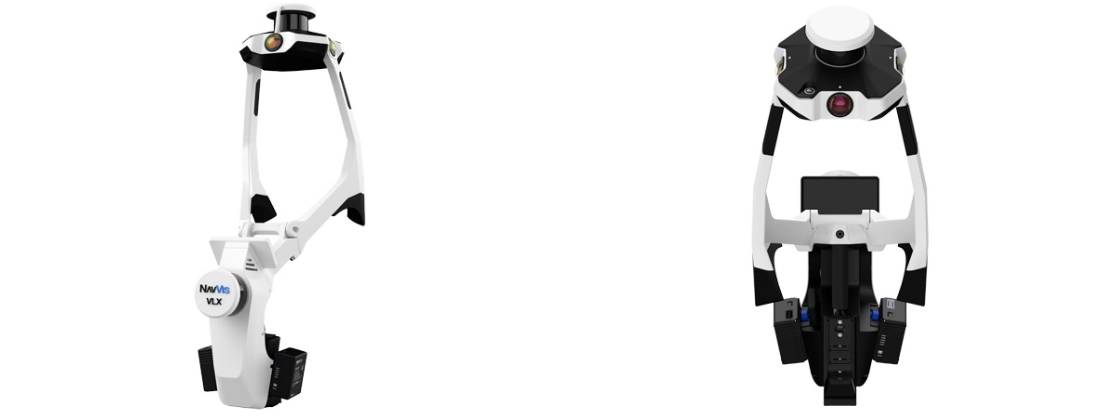
The Lab uses the NavVis VLX 3 wearable LiDAR scanner for high-precision 3D documentation of the built environment, indoors and outdoors. The scanner supports the Lab’s research on cities, workplaces and heritage. It is also available for collaborative and applied research projects with public bodies, academic and cultural institutions, and other organisations.
Click here to read the camera’s detailed specifications from the manufacturer, and click here to view and download a detailed and interactive brochure of the scanner below.

The raw data from each scan are processed to produce a range of outputs, depending on the needs of each project.
3D point clouds
High-density point clouds with integrated image information, available in standard formats:
360° panoramic imagery
High-resolution panoramic images (.JPEG), georeferenced and linked to the point cloud.
Architectural drawings from the 3D model
Drawings are delivered as .DWG and .DXF files (for AutoCAD and similar software) or as .PNG images, at a resolution of up to 1 cm.
3D models
Mesh models (.OBJ, .PLY) for visualisation and further analysis.
Interactive web viewers
The NavVis VLX-3 can be utilized across a broad range of innovative fields of application, especially in urban and peri-urban contexts. Some of these fields include:
Urban environments and change monitoring
Detailed 3D models of streets, neighbourhoods and infrastructure. Compared with earlier datasets, these can reveal changes ranging from new construction to wider processes such as gentrification and touristification.
Public space and environment
Point clouds and panoramic imagery can help assess the condition of public spaces, record urban green and support maintenance and planning.
Cultural heritage
Precise documentation of monuments and archaeological sites, supporting analysis, conservation and restoration.
Labour and industrial sites
Digital documentation of workplaces, industrial zones and technical facilities, such as factories, warehouses and data centres. This supports both labour and heritage research and the documentation of complex indoor infrastructure.
Research, policy and planning
Spatial evidence on the built environment for planners and policymakers.
Community engagement
Virtual tours and immersive visualisations that make spatial data accessible to citizens and stakeholders.


Through the scanner’s applications, our team turns spatial data into meaningful insight, while also combining 3D scanning with expertise in geography and GIS. Specifically, we provide:
We carry out flexible 3D scanning projects tailored to a wide range of objectives, whether capturing a single building, a street, or an entire neighbourhood. Each scan is carefully planned to align with the specific scale and focus of each project.
Using repeat scans, we highlight how places evolve, providing a valuable perspective for understanding urban transformation.
We integrate 3D scans with GIS files, older datasets, and platforms like Google Street View. This allows for deeper spatial analysis and richer storytelling around places.
Our approach is adaptable to the unique character of each project. From data acquisition to visual outputs, we work closely with partners to deliver meaningful and context-sensitive results.
The Lab has carried out pilot scans of pedestrian zones and indoor spaces in Greece, including the scanning of Ermou Street in Mytilene. The video and images below show the scanner’s ability to capture high-resolution imagery, generate detailed point clouds and create accurate 3D models of outdoor and indoor spaces. Examples of the drawings, orthoimages and elevations produced from a demonstration model are also shown. Further examples of the scanner’s use are available here.
Visualisation of Ermou Street, Mytilene, in IVION Core, a cloud-based platform for processing, managing and exploring scan data.


Panoramic imagery and point cloud of Ermou Street, Mytilene, captured with the NavVis VLX 3 during the Lab’s pilot scan.

Top-down orthoimage of the floor plan, produced directly from the point cloud.

Floor plan with a horizontal section at 1.20 m.

North façade as a true-to-scale orthoimage.

North façade as a line drawing (DXF), ready for use in CAD software.
For more information about joint projects, or to arrange a demonstration, please contact us via email at labourgeolab@gmail.com / stgialis@aegean.gr or by calling +30 22510 36642
